Click on Accounting > Reports & Charts to see a list of reports you can generate from your club data. They are divided into three categories: daily, yearly, and miscellaneous. The reports listed below include charts. Click on the report name for more detail. Several examples are shown. Scroll to the bottom of this page for tips on using the charts.
Daily
- Valuation (NAV) Report
Provides a snapshot view of the assets, the number of units outstanding, and the current unit value of a club on a given date. Pie charts are available for market value and cost basis. A bar chart shows unrealized gain/loss.

- Member Status Report
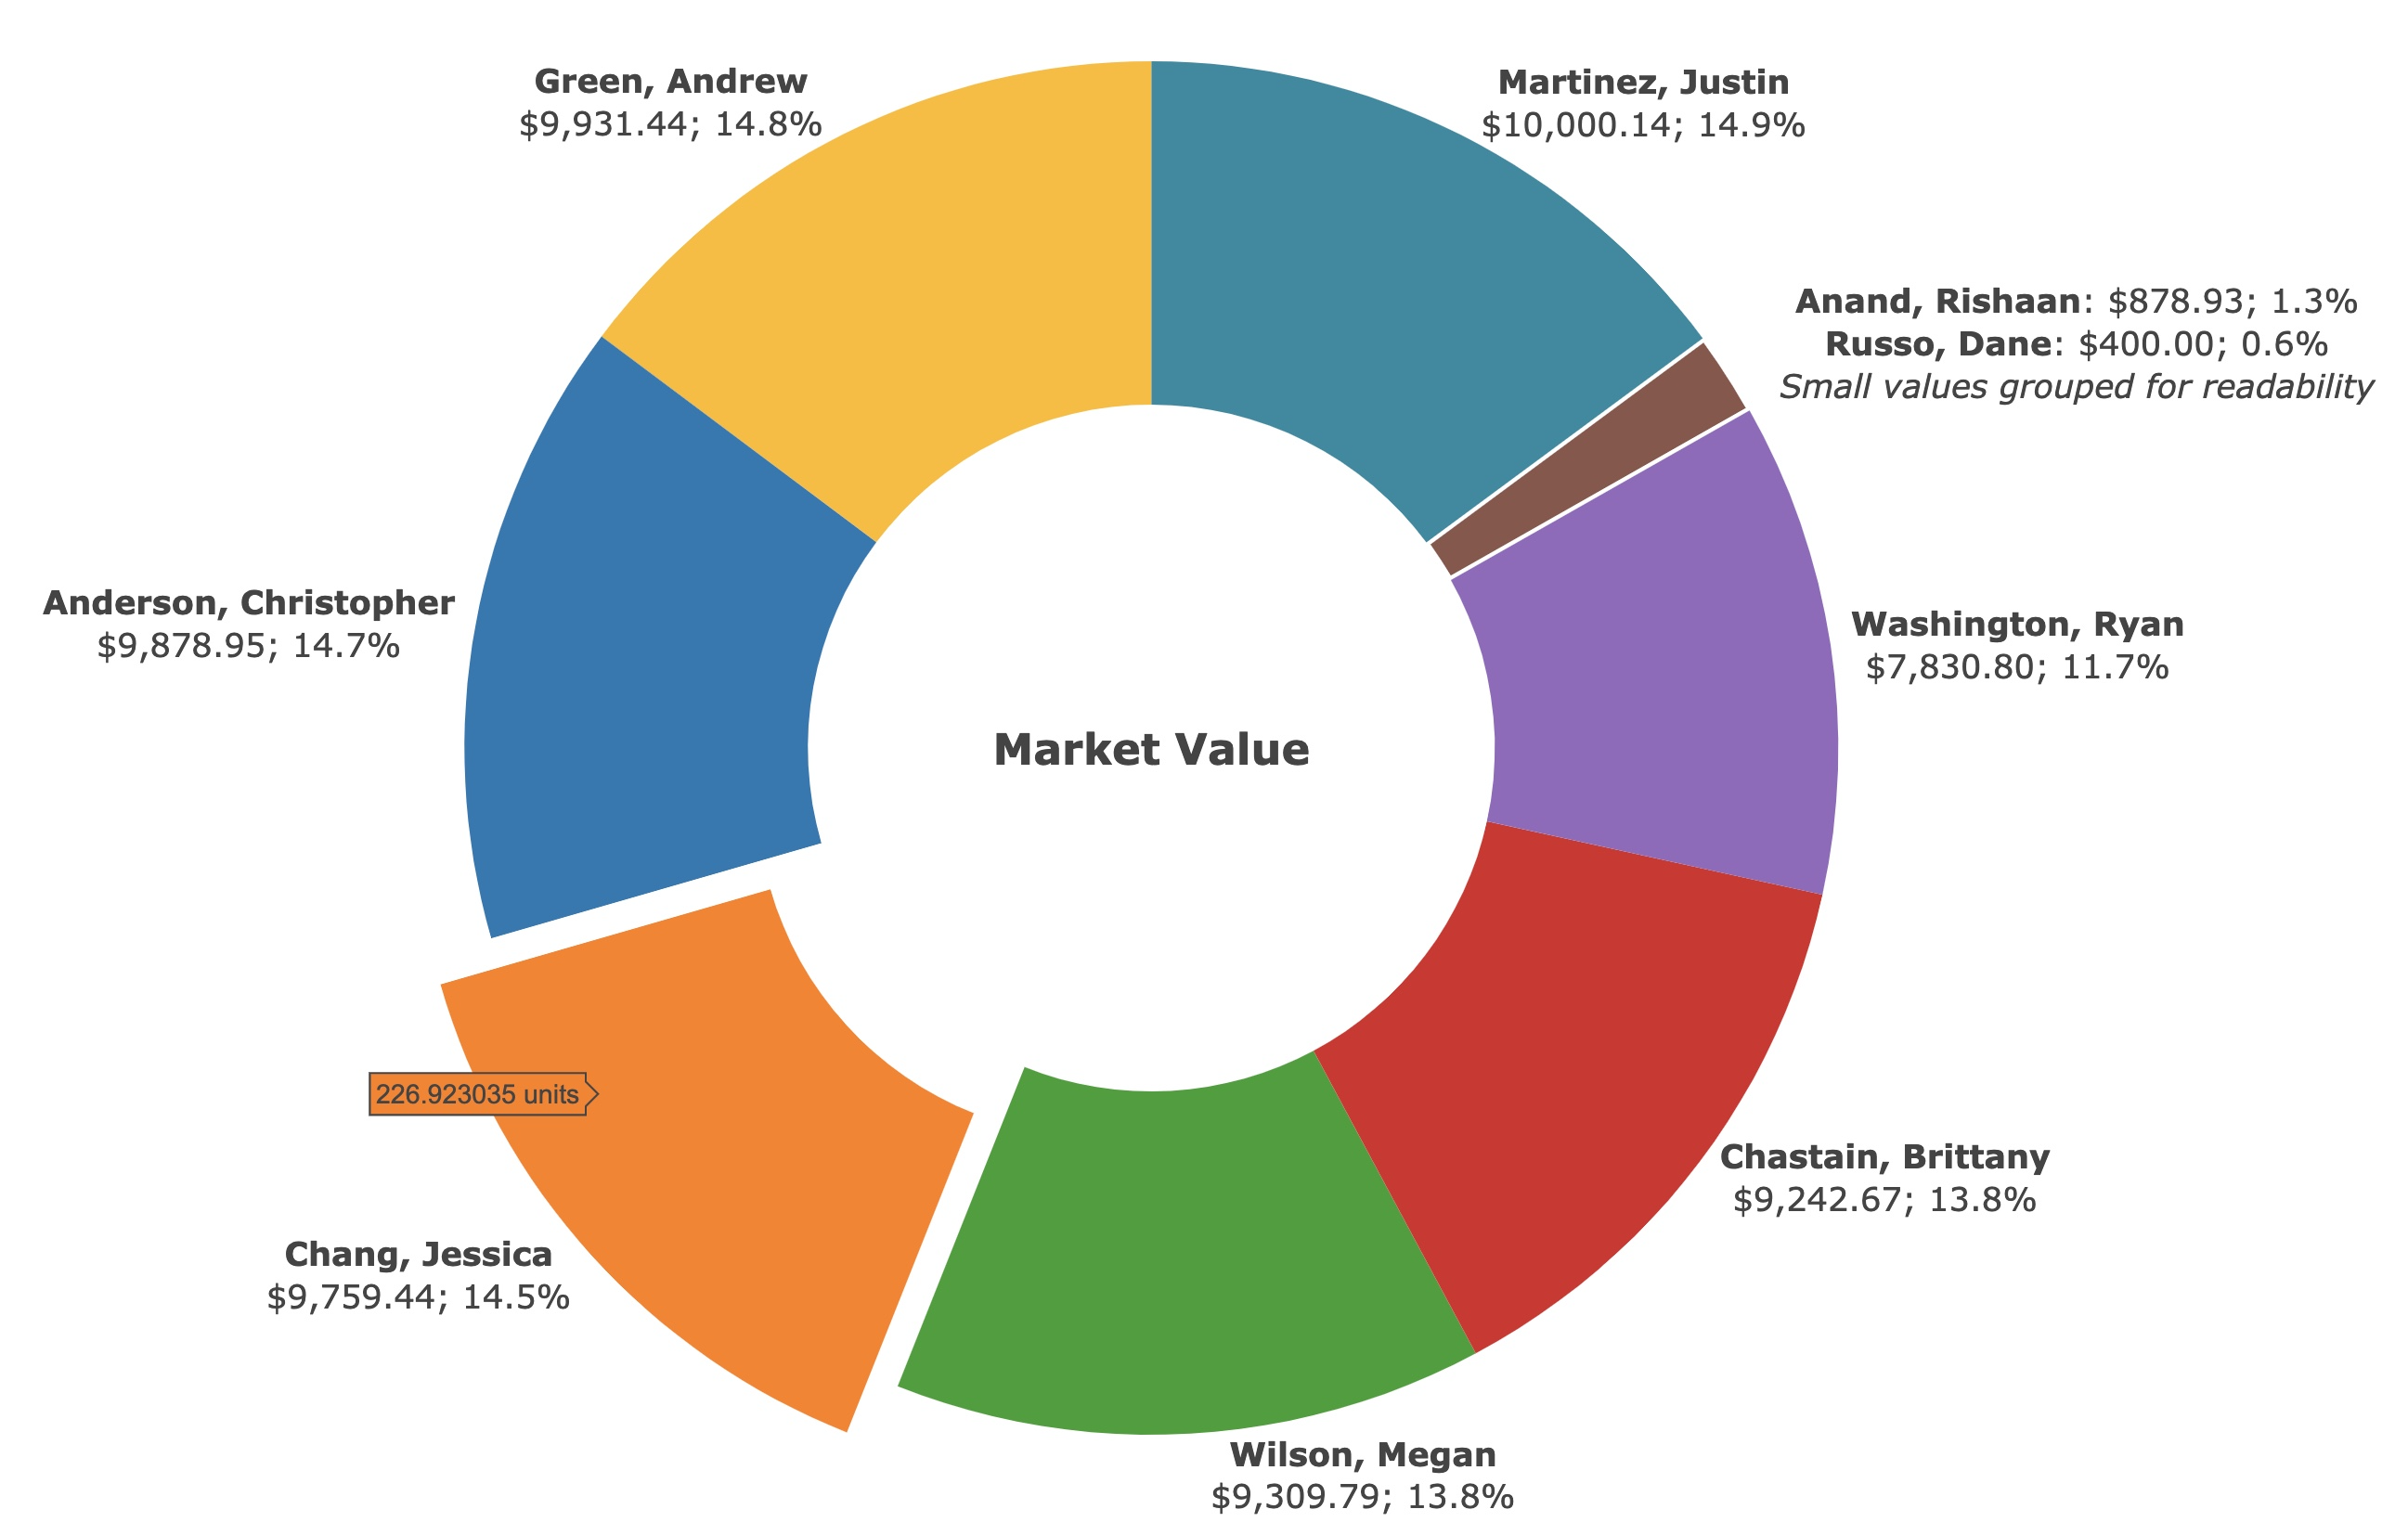
Provides a snapshot view of the account of each member of your club on a selected date. Pie charts are available for market value and tax basis.
- Member Performance Report
Details the performance of each member's investment in the club as of a selected date. A bar chart is available to show annualized internal rate of return. A pie chart shows the market value.
- Investment Performance Report
Details the performance of your club's investment portfolio as of a selected date. A pie chart shows the market value. A bar chart is available to show annualized internal rate of return.

Yearly
- Balance Sheet
Details the capital structure and cost basis of the assets and liabilities of your club. Pie charts are available for total assets and total liabilities. A chart will not display when there is an asset or liability with a negative value.
- Capital Gains and Losses Report
Details investment transactions made during the selected period and the gains or losses realized in conjunction with each transaction. Transactions are categorized as Short-Term or Long-Term Capital Gains based on the holding period of each block of stock sold. Bar charts are available for short-term, long-term, and total capital gains/losses.
The top bar is the sale price. The middle bar is the cost basis. The third bar (the gain or loss) is the difference between sale price and cost basis.

Chart Tips
Click the "Show Charts" box at the bottom of the report page to display the charts. Uncheck the box if you don't want to display or print charts. This setting applies to the current user, similar to the font size setting.

Segments of less than 1% are grouped together on charts. Hovering over segments may show more detail. You can click on one or more segments of pie charts to highlight those items.
When you hover your cursor over a chart, a Camera icon will appear in the top right corner. Click the Camera icon to download and save the current chart.

When printing reports, each chart appears on a separate page with the report title. Change your print settings to Portrait or Landscape as needed for best results when printing individual charts.
More questions? More Help